Fcc Si
Overview > fcc Si > fcc Si DOS > fcc Si bandstructure > cd Si > cd Si volume relaxation > cd Si relaxation > beta-tin Si > fcc Ni > graphite TS binding energy > graphite MBD binding energy > graphite interlayer distance > List of tutorials
Task
Lattice constant optimization for fcc Si.
Input
POSCAR
fcc Si:
 3.9
 0.5 0.5 0.0
 0.0 0.5 0.5
 0.5 0.0 0.5
   1
cartesian
0 0 0
- Fcc Si lattice constant of 3.9 [math]\displaystyle{ \AA }[/math].
- 1 atom per unit cell.
INCAR
System = fcc Si
ISTART = 0 ; ICHARG = 2
ENCUT = 240
ISMEAR = 0; SIGMA = 0.1
- Initial charge density form overlapping atoms.
- Energy cutoff of 240 eV from POTCAR file.
KPOINTS
k-points
 0
Monkhorst Pack
 11 11 11
 0  0  0
- Equally spaced k mesh.
- Odd number of k points in each direction results in a [math]\displaystyle{ \Gamma }[/math] centered mesh.
- 56 k points in IBZ.
Calculation
- Calculate energy for different lattice parameters.
- Fit to some equation of states to obtain the equilibrium volume.
- The bash-script loop.sh runs fcc Si at several different lattice constants (3.5-4.3 Å) and collects free energy versus lattice constant into the file SUMMARY.fcc
#! /bin/bash
BIN=/path/to/your/vasp/executable
rm WAVECAR SUMMARY.fcc
for i in  3.5 3.6 3.7 3.8 3.9 4.0 4.1 4.2 4.3 ; do
cat >POSCAR <<!
fcc:
   $i
 0.5 0.5 0.0
 0.0 0.5 0.5
 0.5 0.0 0.5
   1
cartesian
0 0 0
!
echo "a= $i" ; mpirun -np 2 $BIN
E=`awk '/F=/ {print $0}' OSZICAR` ; echo $i $E  >>SUMMARY.fcc
done
cat SUMMARY.fcc
The output for the SUMMARY.fcc file within this example should look like this:
3.5 1 F= -.44256712E+01 E0= -.44233993E+01 d E =-.454388E-02
3.6 1 F= -.46614699E+01 E0= -.46600410E+01 d E =-.285796E-02
3.7 1 F= -.47979864E+01 E0= -.47959298E+01 d E =-.411323E-02
3.8 1 F= -.48645042E+01 E0= -.48630063E+01 d E =-.299564E-02
3.9 1 F= -.48773847E+01 E0= -.48758538E+01 d E =-.306176E-02
4.0 1 F= -.48487436E+01 E0= -.48481092E+01 d E =-.126878E-02
4.1 1 F= -.47852634E+01 E0= -.47844854E+01 d E =-.155599E-02
4.2 1 F= -.46936947E+01 E0= -.46922530E+01 d E =-.288339E-02
4.3 1 F= -.45831167E+01 E0= -.45811837E+01 d E =-.386598E-02
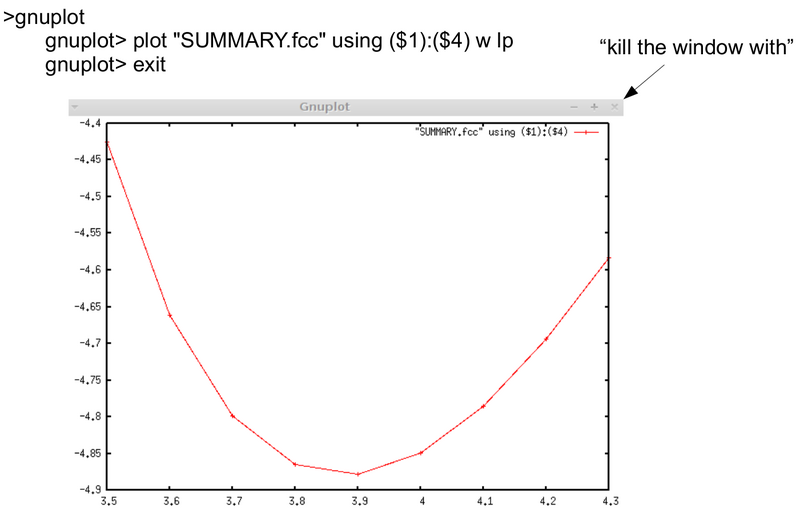
- To make a quick plot of SUMMARY.fcc try:
gnuplot
gnuplot> plot "SUMMARY.fcc" using ($1):($4) w lp
- The equilibrium lattice constant is found at roughly 3.9 Å. Adjust your POSCAR file to reflect this and rerun VASP.
- Keep your CHGCAR file from this run. We will need it in the following examples.
- A quick look at the results:
Mind: You will have to set the correct path to your VASP executable (i.e., BIN), and invoke VASP with the correct command (e.g., in the above: mpirun -np 2).
Download
Overview > fcc Si > fcc Si DOS > fcc Si bandstructure > cd Si > cd Si volume relaxation > cd Si relaxation > beta-tin Si > fcc Ni > graphite TS binding energy > graphite MBD binding energy > graphite interlayer distance > List of tutorials
Back to the main page.

